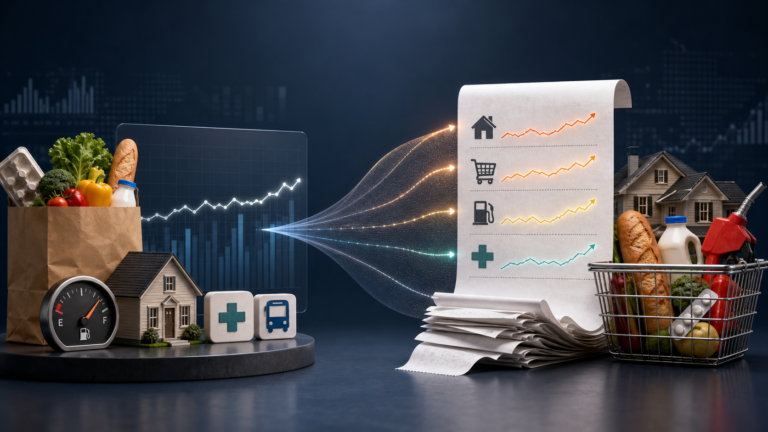
Official inflation can be accurate for the population it measures and still feel completely wrong for your household. The reason is in the weights.
By MultiCalculators Editorial Team · Published July 31, 2026 · Based on BLS, Federal Reserve, Social Security Administration, and Congressional Research Service sources
The Consumer Price Index measures the average change in prices paid by urban consumers for a weighted basket of goods and services. It does not measure your exact grocery list, rent, mortgage, commute, insurance bill, or medical needs. Your personal inflation rate can therefore be above or below CPI without either number being fraudulent.
That distinction matters when prices move unevenly. In June 2026, the all-items CPI-U was 3.5% higher than a year earlier. Energy was up 15.7%, food was up 3.0%, shelter was up 3.3%, and medical care was up 2.0%, according to the Bureau of Labor Statistics. Households experienced very different mixtures of those changes.
How is CPI calculated?
BLS calculates CPI by collecting prices for a representative sample of goods and services, measuring price change within item and geographic cells, and combining those changes with consumer-spending weights. The final number is an index. Inflation is the percentage change in that index between two dates.
The inflation-rate formula
Inflation rate = ((new CPI ÷ old CPI) − 1) × 100
If CPI rises from 300 to 309, the calculation is ((309 ÷ 300) − 1) × 100 = 3%.
Step 1: Define what CPI is supposed to measure
CPI-U tracks prices paid by urban consumers, a population covering most U.S. residents. CPI-W covers urban wage earners and clerical workers. Neither is a universal household ledger. The index measures consumer prices within its defined population, geography, item scope, and cost-of-living framework.
Step 2: Build expenditure weights
BLS uses the Consumer Expenditure Survey to estimate how consumers distribute spending. Since January 2023, CPI-U and CPI-W upper-level weights have been updated annually using one calendar year of expenditure data. The weights remain fixed for 12 months before the next annual update.
Step 3: Collect and adjust prices
Price collectors and other data sources track specific items in selected outlets and locations. BLS tries to compare equivalent products over time. When product features change, quality adjustments attempt to separate a price increase from an improvement in what the buyer receives.
Step 4: Combine thousands of component indexes
At lower levels, geometric-mean formulas allow some substitution among similar products within an item category. At upper levels, CPI-U combines item-area indexes using expenditure weights. The result is not a simple average of price changes and is not produced by checking a single national shopping cart.
What are the eight major CPI categories and their weights?
Housing dominates CPI-U. In the December 2025 relative-importance table, housing represented 44.469% of all items and shelter alone represented 35.625%. Transportation followed at 16.316%, while food and beverages accounted for 14.539%.
| Major group | CPI-U weight | What it broadly covers |
|---|---|---|
| Housing | 44.469% | Shelter, utilities, household furnishings, and operations |
| Transportation | 16.316% | Vehicles, fuel, insurance, repairs, fees, and public transport |
| Food and beverages | 14.539% | Groceries, restaurant food, and alcoholic beverages |
| Medical care | 8.423% | Out-of-pocket medical goods and services represented in CPI |
| Education and communication | 5.846% | Tuition, childcare, phones, internet, and information technology |
| Recreation | 5.137% | Entertainment, pets, sporting goods, admissions, and related services |
| Other goods and services | 2.902% | Personal care, tobacco, legal, funeral, and financial services |
| Apparel | 2.368% | Clothing, footwear, jewelry, and watches |
These eight figures total 100%. Notice that “housing” is broader than “shelter.” It includes utilities and household operations, so it should not be compared directly with the rent line in your budget.
The weights explain why a spectacular increase in a small category may barely move the all-items index. Conversely, a modest shelter increase can move CPI considerably because shelter carries more than one-third of the basket.
Why does CPI use owners' equivalent rent for housing?
BLS treats an owner-occupied home as a capital asset that provides a flow of shelter services. It therefore estimates what the home would rent for, rather than inserting house prices or mortgage payments directly. Owners' equivalent rent carried 26.204% of CPI-U in December 2025.
What owners' equivalent rent means
Owners' equivalent rent, or OER, is the implicit rental value of an owner’s home. Consumer Expenditure Survey respondents are asked what their home would rent for monthly, unfurnished and without utilities. Those responses help establish expenditure weights.
Price movement is not calculated by asking homeowners to guess every month. BLS uses observed rents from sampled rental units and applies methods designed to represent owner-occupied housing. The rent sample is divided into six panels, and sampled units are generally priced every six months.
What CPI leaves out of owner-occupied shelter
Home purchase prices, mortgage interest, property taxes, real-estate fees, most maintenance, and improvements are outside the CPI shelter-services measure. BLS classifies the house itself as an investment good rather than current consumption.
Why OER is controversial
OER is large, indirect, and slow-moving. Rents often change when leases reset or tenants move, so market asking rents can turn before CPI rent measures do. The rental sample must also stand in for owner-occupied homes, whose locations and structure types differ.
BLS refined OER unit weights in January 2023 to better represent single-family detached homes using American Community Survey data. That change illustrates both sides of the debate: the method is more sophisticated than critics imply, yet it still relies on modeling choices that deserve scrutiny.
Core CPI versus headline CPI: does the Fed ignore food and energy?
No. Headline CPI includes food and energy, while core CPI excludes them to reduce short-term volatility. Federal Reserve officials monitor both, but the Fed’s formal 2% inflation objective is defined using the broader Personal Consumption Expenditures price index, not CPI.
Food and energy can jump because of weather, geopolitics, refinery disruptions, or commodity markets, then reverse. Core measures help policymakers ask whether inflation is spreading through wages, rents, and services in a way likely to persist.
That analytical choice does not mean food and gasoline “do not count.” The Federal Reserve says food and energy are important household expenses and that policymakers ultimately seek stability in overall consumer prices. Core inflation is a diagnostic lens, not a substitute grocery receipt.
| Measure | Includes food and energy? | Primary use |
|---|---|---|
| Headline CPI | Yes | Broad consumer-price change for the CPI population |
| Core CPI | No | Underlying CPI trend with two volatile groups removed |
| Headline PCE | Yes | The price index used for the Federal Reserve’s inflation objective |
| Core PCE | No | A commonly watched measure of persistent inflation pressure |
How can your personal inflation rate be three times the official number?
Your personal rate can be far above CPI when your budget is concentrated in categories rising faster than the average. In June 2026, overall CPI-U was up 3.5% year over year, but energy was up 15.7% and transportation was up 6.5%.
A simple personal-inflation formula
Personal inflation ≈ Σ(your category spending share × category price change)
Your spending shares should total 100%. Convert percentages to decimals before multiplying.
A transparent stress-test example
Suppose a household spends heavily on commuting, rent, groceries, and medical care. The following figures are hypothetical, designed to show the math—not to describe the average U.S. household or current BLS category rates.
| Category | Household weight | Illustrative price change | Contribution |
|---|---|---|---|
| Housing | 40% | 8% | 3.20 points |
| Food | 25% | 10% | 2.50 points |
| Transportation and energy | 20% | 20% | 4.00 points |
| Medical care | 10% | 7% | 0.70 points |
| Everything else | 5% | 4% | 0.20 points |
| Total | 100% | — | 10.60% |
A 10.6% household rate is just over three times a 3.5% official rate. Nothing in the example proves that a specific household experienced 10.6%. It proves that a threefold gap is mathematically possible when household weights and category changes differ sharply from the national basket.
Why a personal rate differs even with perfect weights
- Geography: local rent, insurance, utilities, and taxes can diverge from national indexes.
- Housing status: a long-time fixed-rate homeowner and a new renter face different cash-flow changes.
- Age and health: medical needs vary dramatically.
- Household composition: childcare, tuition, and food needs change with family size.
- Product choice: brands, stores, package sizes, and quality levels matter.
- Substitution: consumers may replace expensive products with cheaper alternatives.
- Timing: annual insurance renewals and lease resets hit households in different months.
What is chained CPI, and does it reduce benefits?
Chained CPI-U uses current and previous-month expenditure patterns to reflect substitution across categories. Its final version uses a Törnqvist formula. Because required spending data arrive later, final chained-CPI values are released about 10–12 months after the initial index.
CPI-U versus C-CPI-U
Traditional CPI-U upper-level weights remain fixed for a year. Chained CPI uses changing monthly expenditure shares in its final calculation. If beef becomes expensive and consumers buy more chicken, chained CPI captures more of that cross-category shift.
That does not mean consumers are equally satisfied after every substitution. Switching from steak to chicken, driving less, moving, or delaying medical care may preserve spending while reducing convenience or welfare. A price index can model purchasing behavior without measuring happiness.
Where chained CPI affects your money
The 2017 federal tax law adopted chained CPI for many income-tax parameters. Because chained CPI has generally grown more slowly than CPI-U, tax brackets and some deductions tend to rise more slowly than they would under the older method. Over time, that can increase tax liabilities relative to CPI-U indexing.
Does Social Security currently use chained CPI?
No. Social Security COLAs currently use CPI-W. The Social Security Administration says the 2026 COLA was 2.8%, based on the CPI-W increase from the third quarter of 2024 through the third quarter of 2025. Chained CPI has been proposed for benefits, but a proposal is not current law.
What would $100 from 1950 buy today?
The annual-average CPI-U for 1950 was 24.1 on the 1982–84 base. The June 2026 index was 333.952. Using those values, $100 in 1950 had roughly the same average purchasing power as $1,386 in June 2026.
The purchasing-power calculation
$100 × (333.952 ÷ 24.1) = $1,385.69
The reverse comparison is equally revealing: $100 in June 2026 had the purchasing power of about $7.22 in 1950 dollars. This does not mean every item became 13.86 times more expensive. Technology, medical services, housing, food, and wages followed very different paths.
Long-period inflation calculations also compare consumer baskets that changed substantially. A 1950 household did not buy smartphones, streaming subscriptions, or modern medical treatments. BLS quality adjustments and changing samples help maintain comparability, but no 76-year comparison is a literal receipt-for-receipt match.
What does an inflation calculator use?
A standard U.S. inflation calculator usually uses CPI-U index values. It divides the ending-period CPI by the starting-period CPI, then multiplies the original dollar amount by that ratio. It estimates equivalent average purchasing power; it does not reconstruct your personal expenses.
For an amount A, starting index CPI₁, and ending index CPI₂:
Inflation-adjusted value
Adjusted value = A × (CPI₂ ÷ CPI₁)
How our inflation calculator uses BLS data
The inflation calculator should identify the exact BLS series, periodicity, and date convention used. Annual calculations commonly use annual-average CPI-U. Month-specific calculations should use monthly, not seasonally adjusted CPI-U values when comparing purchasing power across exact months.
What the result does not tell you
- Your household’s personal inflation rate
- Investment returns after tax
- Whether wages kept pace with living costs
- The change in home prices or mortgage affordability
- Regional differences hidden by a national average
- Whether product quality improved or deteriorated from your perspective
An inflation adjustment is also not an investment projection. Compare purchasing-power loss with potential growth using the compound interest calculator and measure investment performance with the ROI calculator.
For long-term wealth targets, the millionaire calculator can show how contributions and returns interact. Treat its future dollar target in real, inflation-adjusted terms if purchasing power is what matters.
Frequently asked questions
How is the inflation rate calculated?
For a price index, inflation is the percentage change between two index values: ((new index ÷ old index) − 1) × 100. The U.S. CPI combines thousands of price changes using expenditure weights derived mainly from the Consumer Expenditure Survey.
Why is my personal inflation higher than CPI?
Your spending weights differ from the national CPI basket. If you spend more than average on categories with fast price growth, your personal inflation will be higher. Geography, household size, age, housing status, product choices, and timing also create differences.
Does CPI include house prices and mortgage payments?
CPI does not treat a home purchase as current consumption. For owner-occupied shelter, BLS estimates the rental value of the housing service through owners' equivalent rent. Home prices, mortgage interest, property taxes, most maintenance, and improvements are outside that shelter measure.
Why does core CPI exclude food and energy?
Food and energy can move sharply and reverse direction, so excluding them can help analysts see persistent inflation trends. Policymakers still monitor headline inflation because households pay for both. The Federal Reserve’s formal inflation goal uses the broader PCE price index, not CPI.
Does Social Security use chained CPI?
No. Under current law, Social Security COLAs use CPI-W. The 2026 COLA was 2.8%, based on the change in CPI-W from the third quarter of 2024 to the third quarter of 2025. Chained CPI is used for many federal income-tax inflation adjustments.
The CPI is a map, not your receipt
CPI is neither a conspiracy nor a perfect description of household pain. It is a carefully defined statistical average. Its usefulness comes from consistency across time, while its limitations come from the same standardization: no shared basket can mirror every family.
Use CPI to compare broad purchasing power. Use category indexes to find the pressure points. Use your bills and spending shares to estimate personal inflation. Keeping those three layers separate produces a clearer answer than either blind trust or blanket rejection.
Sources and methodology
- U.S. Bureau of Labor Statistics, Consumer Price Index
- BLS Handbook of Methods: CPI calculation
- BLS CPI relative importance, December 2025
- BLS, Rent and owners' equivalent rent methodology
- BLS, Chained CPI questions and answers
- BLS Consumer Price Index, June 2026
- Federal Reserve, How policymakers evaluate inflation
- Social Security Administration, 2026 COLA fact sheet
- Congressional Research Service, 2017 tax-law inflation indexing
Historical calculation: $100 × (June 2026 CPI-U 333.952 ÷ 1950 annual-average CPI-U 24.1) = $1,385.69. Values use the BLS U.S. city average, all-items CPI-U, 1982–84=100. Current data were checked July 31, 2026.
Author

Shakeel Muzaffar is the Founder and Editor-in-Chief of MultiCalculators.com, bringing over 15 years of experience in digital publishing, product strategy, and online tool development. He leads the platform's editorial vision, ensuring every calculator meets strict standards for accuracy, usability, and real-world value. Shakeel personally oversees content quality, formula verification workflows, and the platform's commitment to publishing tools that are genuinely useful for students, professionals, and everyday users worldwide.